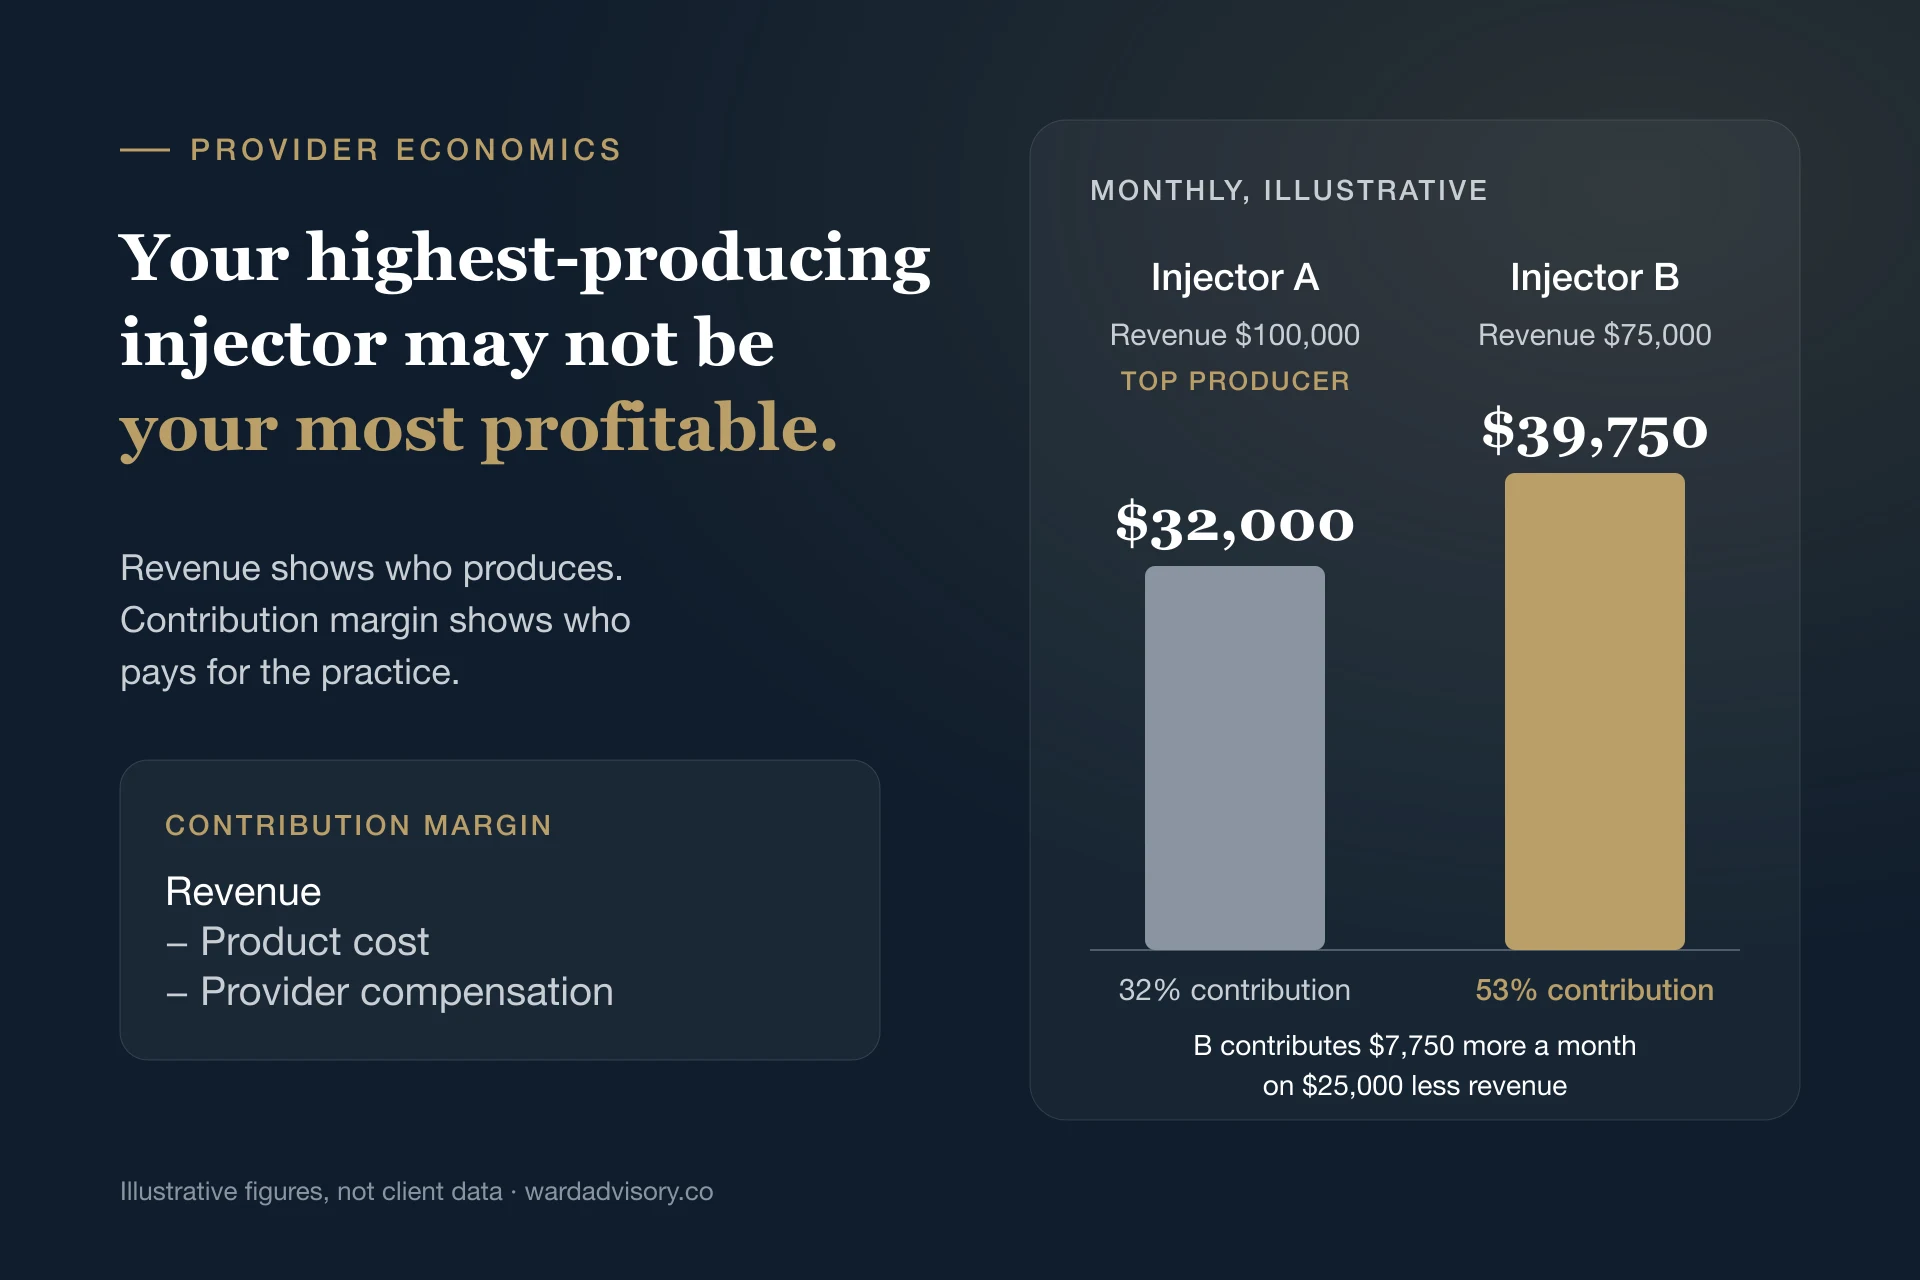
Is Your Injector Compensation Plan Costing You Margin? A Diagnostic Framework
A diagnostic framework for auditing your med spa's injector compensation plan: five checks that reveal whether your pay structure is costing you margin.
What this helps diagnose:You are not sure whether your injector pay plan is quietly costing margin.

You already suspect something is off. The schedule is full, the injectors are busy, and the top-line revenue number looks healthy on the monthly report. But the owner paycheck does not match the effort, and you cannot point to exactly why.
This diagnostic answers a different question than provider profitability analysis. Provider profitability analysis identifies which injectors create margin, using contribution margin per provider as the yardstick. Compensation diagnostics identify whether the pay structure itself, the rates, floors, and thresholds you set, is causing margin leakage regardless of which injector is working under it. A high-margin injector on a broken pay structure and a low-margin injector on a well-designed one can both be hiding the same underlying problem: nobody has checked the plan itself.
This is not another explainer on compensation models or a walkthrough of why revenue and profit diverge. It is a five-check audit of the pay structure you already have, run against your own numbers this week, to find out whether the plan is the leak.
Table of Contents
- Why "Busy" Doesn't Answer This Question
- The Five-Check Compensation Diagnostic
- Check 1: The Blended Compensation-to-Revenue Ratio
- Check 2: The Per-Injector Spread
- Check 3: The Service-Mix Distortion
- Check 4: The Floor Test
- Check 5: The Trend Direction
- Worked Example: Running the Full Diagnostic
- What to Do With a Confirmed Diagnosis
- Your Next Step
- Frequently Asked Questions About the Injector Compensation Diagnostic
Why "Busy" Doesn't Answer This Question
A full schedule tells you demand exists. It does not tell you whether the plan splitting each dollar between provider and practice is doing what you designed it to do. Most owners never audit their compensation structure because nothing prompts them to. Payroll clears every two weeks, production reports look fine in isolation, and the plan itself was set once, at hiring, and never revisited.
The four standard compensation models each carry a defensible logic on paper. What none of them guarantee on their own is that the specific rates and thresholds you chose are still behaving the way you intended once real production numbers run through them. That is a structural question about the plan, not a question about which injector is more profitable — for that analysis, provider profitability is the right framework, and this diagnostic assumes you either already have that answer or are running the two side by side.
The diagnostic below does not ask which model you use, and it does not rank your injectors. It asks whether the model you have is behaving the way you think it is.
The Five-Check Compensation Diagnostic
Five checks, run against three months of actual payroll and production data, are enough to surface the failure modes that quietly erode margin. Each check answers a distinct question; none of them substitute for the others.
| Check | What It Answers |
|---|---|
| Blended compensation-to-revenue ratio | Is total injector pay, across the whole team, consuming too much of injectable revenue? |
| Per-injector spread | Is one injector's structure hiding a problem the blended number masks? |
| Service-mix distortion | Is the plan paying the same rate on services with very different margins? |
| Floor test | Does the practice lose money on slow days because there is no production floor? |
| Trend direction | Is the ratio drifting worse over time, even if it looks acceptable today? |
Check 1: The Blended Compensation-to-Revenue Ratio
Add up every injector's total compensation for the last full month, base pay plus commission plus any bonus or profit-sharing paid in cash. Divide by total injectable revenue for the same period. That is your blended ratio.
Use the payroll definitions to compare the blended ratio with the practice's own cost model and prior periods, keeping the revenue and compensation definitions consistent. A ratio alone cannot establish profitability because product cost, service mix, and overhead still need to be covered.
This first check is a smoke test, not a diagnosis. A blended ratio can hide a problem at one provider or service line, which is what Check 2 examines.
Check 2: The Per-Injector Spread
Run the same ratio individually for each injector, not averaged together. A practice with two injectors at 22 percent and one at 45 percent will show a comfortable blended ratio in the high 20s, even though the higher compensation burden on that one provider may be compressing the practice's contribution margin.
Compensation-to-Revenue Ratio Formula
Compensation-to-Revenue Ratio = Total Injector Compensation ÷ Injectable Revenue Generated
Write down each injector's individual ratio. Investigate material differences against the actual service mix, prices, paid hours, and compensation terms. A spread is a prompt for analysis, not a universal pass/fail threshold.
Check 3: The Service-Mix Distortion
Most compensation plans pay one flat rate across every service an injector performs, regardless of that service's underlying margin. Neurotoxin, filler, and device treatments typically carry different product-cost and time profiles, which means a flat commission rate effectively overpays on the lower-margin service and underpays on the higher-margin one relative to what each actually contributes.
Pull one injector's production mix for the last month: how much came from neurotoxin, how much from filler, how much from device or laser work. If commission is paid at the same rate across all three despite different margins, the plan is not distinguishing between a dollar of high-margin revenue and a dollar of low-margin revenue, and an injector can shift their own effort toward whichever service is easiest to produce without the practice's margin keeping pace with their production.
Check 4: The Floor Test
Ask whether commission is paid from the first dollar of production or only above a defined threshold. A plan with no floor pays commission even on a slow day when the injector's own base cost and room overhead have not yet been covered by their production. Over a full month this can still average out to an acceptable blended ratio while individual slow days quietly lose money.
The fix is not eliminating commission below the floor. It is confirming a floor exists at all, and that it roughly matches the injector's daily cost to the practice, base pay plus their share of fixed overhead, before commission begins accruing.
Check 5: The Trend Direction
Compare the blended ratio from Check 1 across the last three months, not just the most recent one. A ratio that is stable or improving is a different situation than one drifting upward even by a few points a month. That drift is not always caused by a change to any individual injector's plan — it can also happen mechanically as a higher-ratio injector's share of total production grows relative to the team, which is exactly why the trend has to be checked at the practice level, not assumed from any one injector's structure alone.
A single month's ratio, in isolation, cannot show this. Three consecutive data points can.
Worked Example: Running the Full Diagnostic
Consider a two-injector practice. Injector A produces $55,000 in monthly injectable revenue on a straight 35 percent commission with no floor, up from $40,000 three months ago. Injector B produces $70,000 on a hybrid structure: a $7,000 base plus 18 percent commission on production above $25,000, unchanged over the same period.
Check 1 (blended ratio): Injector A's compensation is $19,250 (35 percent of $55,000). Injector B's compensation is $7,000 base plus 18 percent of $45,000 commissionable production ($8,100), totaling $15,100. Combined compensation is $34,350 against combined revenue of $125,000, a blended ratio of 27.5 percent — inside the illustrative diagnostic range used above, and not itself a red flag.
Check 2 (per-injector spread): Injector A's individual ratio is 35 percent (19,250 ÷ 55,000). Injector B's is 21.6 percent (15,100 ÷ 70,000). The spread is 13.4 percentage points — a difference that warrants examining the blended number in Check 1 warrants further investigation into Injector A specifically.
Check 3 (service-mix distortion): Injector A's production is 70 percent neurotoxin and 30 percent filler, both paid at the same flat 35 percent rate. Since neurotoxin and filler typically carry different margin profiles, the flat rate is not calibrated to either service specifically — it was likely set as a round, easy-to-communicate number rather than modeled against actual product costs.
Check 4 (floor test): Injector A has no production floor; commission accrues from the first dollar. On a day where Injector A produces well below their average, the practice still pays the same 35 percent regardless of whether that day's production covered its own overhead.
Check 5 (trend direction): Injector A's individual ratio is fixed at 35 percent by the straight-commission structure — it does not move with revenue, then or now. What has moved is the practice-level blended ratio: three months ago, at Injector A's then-lower $40,000 revenue, the blended ratio was 26.5 percent ((0.35 × 40,000 + 15,100) ÷ (40,000 + 70,000) = 29,100 ÷ 110,000); today, with Injector A's revenue grown to $55,000 and Injector B unchanged, it is 27.5 percent, matching Check 1. The one-point drift is not a change to either injector's plan — it is Injector A's larger revenue share (36.4 percent of the total three months ago, versus 44.0 percent today) pulling the blend toward Injector A's higher, unchanged 35 percent ratio.
Diagnosis: the blended ratio alone (Check 1) would have looked acceptable and told the owner nothing was wrong. The remaining four checks isolate Injector A's straight-commission structure, with no floor and no service-mix differentiation, as the area warranting a closer look — and Check 5 shows that provider's growing revenue share is now pulling the whole practice's blended ratio upward, even though nothing about the underlying plan has changed. The five checks flag where to look; they do not by themselves prove the compensation structure should change. The next management decision is not to renegotiate both injectors' pay. It is to model provider- and service-level contribution margin for Injector A and test how an alternative structure, such as a floor and service-differentiated rates similar to Injector B's existing plan, would have performed against actual production before changing the agreement.
What to Do With a Confirmed Diagnosis
A confirmed problem on one or more of the five checks does not mean starting from zero. It means the fix is narrower and more specific than "redo compensation." If Check 2 isolates one provider, the correction targets that provider's structure, not the whole team's. If Check 3 flags service-mix distortion, the fix is differentiated commission rates, not a lower flat rate across the board. If Check 4 flags a missing floor, adding one changes the plan's downside protection without touching the upside an injector is used to earning.
The communication challenge is real but manageable: a provider who has been over-earning relative to their production will sometimes resist a structural correction. Framing the change around the specific check that failed, rather than a vague sense that "the numbers need to work better," gives the conversation something concrete to work from instead of an argument about fairness in the abstract.
Your Next Step
Running these five checks by hand, correctly, requires clean per-injector production and compensation data going back at least three months, and most owners discover during Check 1 that they do not have that data cleanly separated to begin with. That gap, not the arithmetic, is usually the real obstacle.
If the checks point to a problem, the next question is how large it is and which specific plan or provider is driving it. That is diagnostic work on your actual payroll and production records; see how Ward Advisory approaches a diagnosis. Keeping a corrected structure on track month to month is the job of the KPI dashboard and, for many practices, a fractional CFO for med spas. For the design side of the same question, see the four standard compensation models.
Frequently Asked Questions About the Injector Compensation Diagnostic
How do I know if my injector compensation plan needs a diagnostic?
The clearest signal is a gap between how busy the practice feels and how much owner profit actually lands. If your schedule is full but net margin is thin, and you have never audited the pay structure itself, that is the sign a diagnostic is overdue. Waiting for the number to become obviously wrong costs more than checking it now.
Is this different from a provider profitability analysis?
Yes, and they answer different questions. Provider profitability analysis identifies which injectors create the most margin, using contribution margin per provider as the yardstick. This diagnostic checks whether the pay structure itself is causing margin leakage, independent of which specific injector is working under it. A practice can run both: profitability analysis tells you who is contributing the most, and this diagnostic tells you whether the plan paying them is structurally sound.
How long does an injector compensation diagnostic take?
Pulling the underlying numbers, three months of per-injector production and total compensation, takes most owners under an hour once they know what to pull. Working through all five checks against those numbers takes another 60 to 90 minutes. The harder part is usually not the math. It is having accurate per-injector data to begin with, which is often the first thing a diagnostic exposes.
What if the diagnostic finds a problem — do I have to fire my injector?
No. In most cases the fix is restructuring the compensation model, not replacing the provider. A high producer on a bad structure is still a high producer; the plan is what is misallocating the margin. Termination is rarely the right first move and is usually unnecessary once the structure itself is corrected.
See this problem in your practice?
Ward Advisory can help work out how large the financial impact actually is and what's driving it.
Request a Strategy CallAbout the author
Tanner Ward
Founder of Ward Advisory. Tanner works with established med spas and aesthetic practices on where profit and cash are being lost and what to change, drawing on 10+ years of finance and operating experience.