
Provider & Capacity Economics
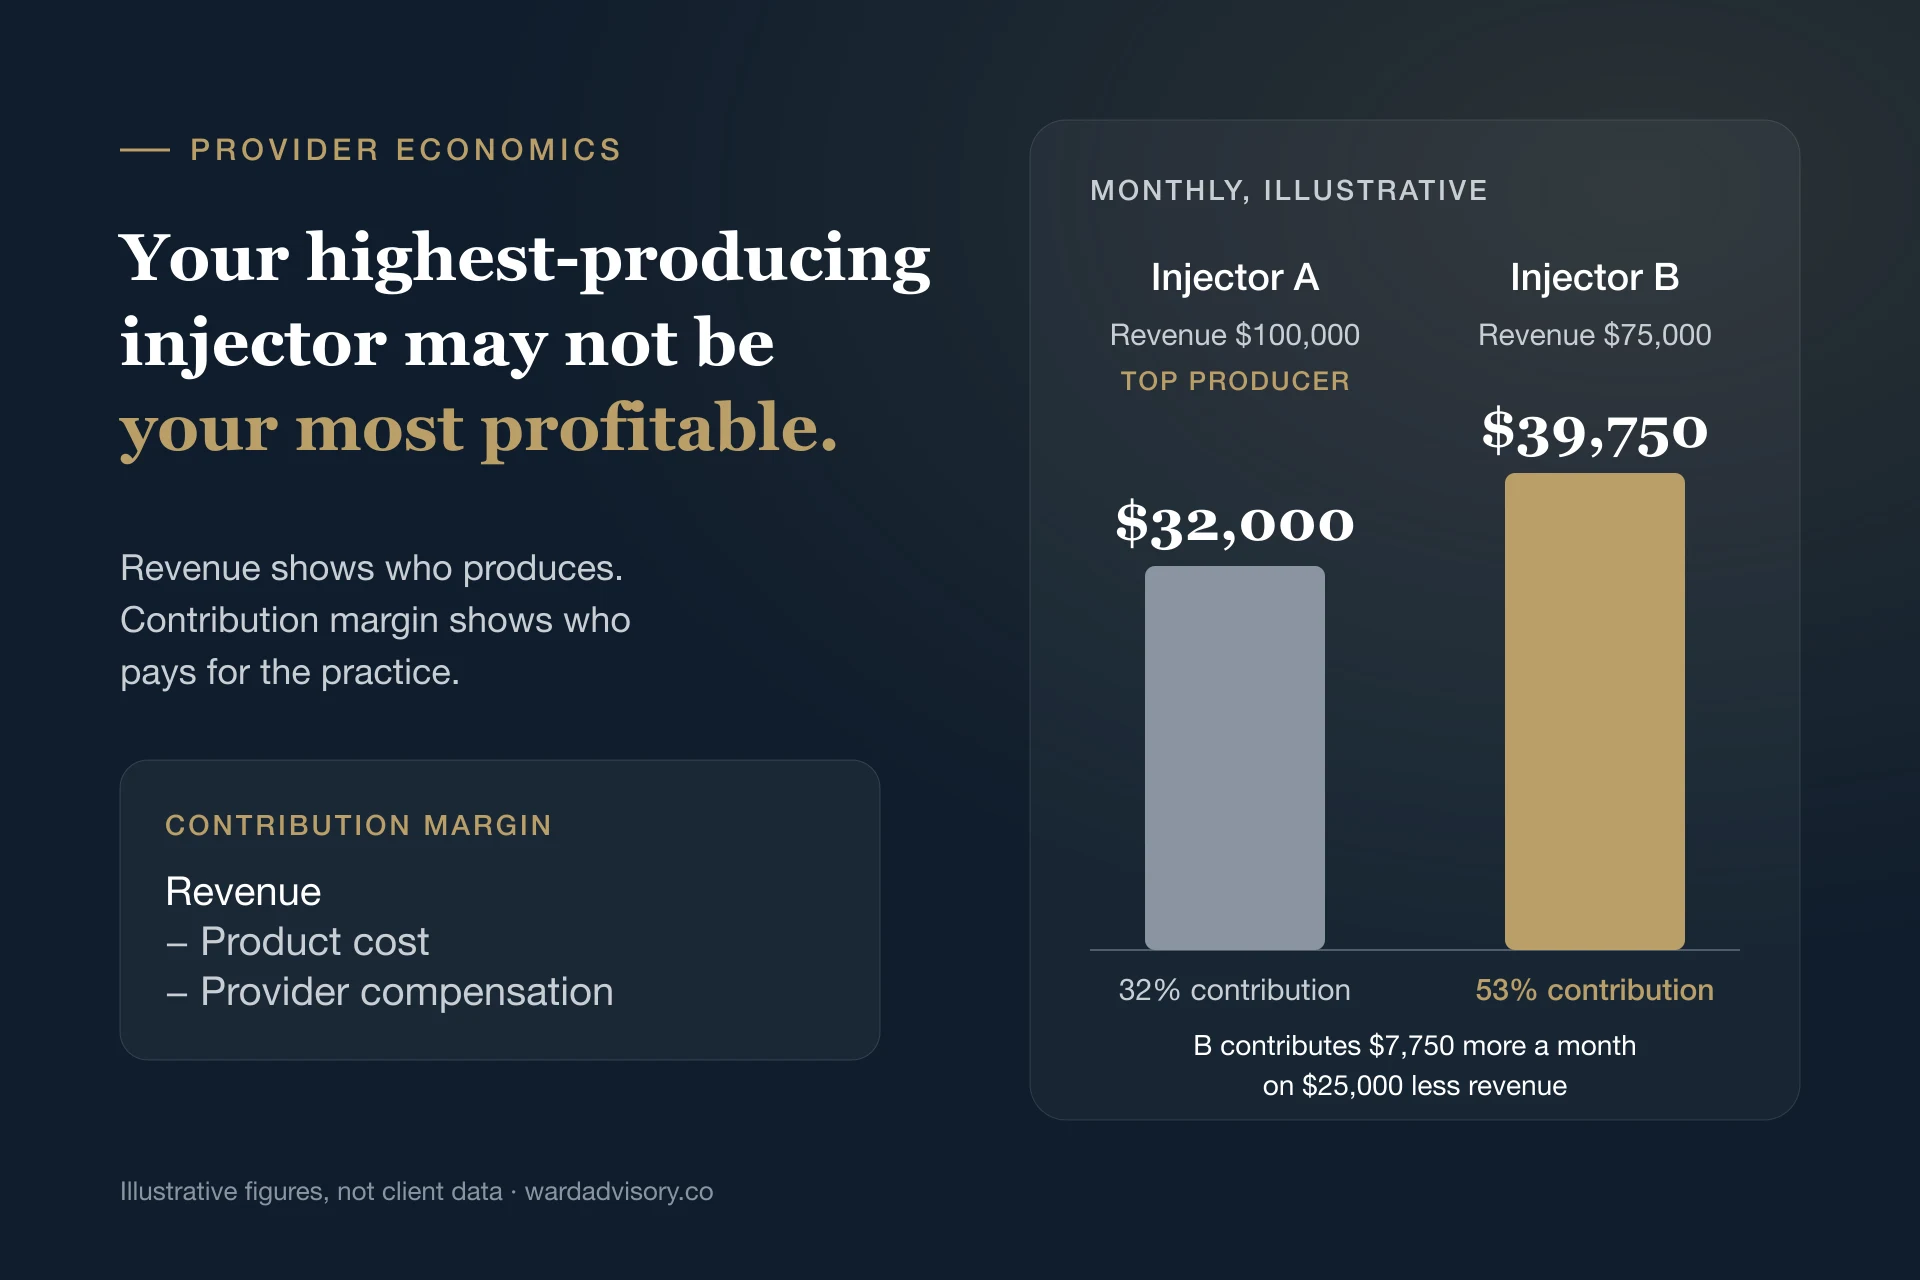
Why Your Highest-Producing Injector May Not Be Your Most Profitable
Helps diagnose: Your top-producing injector may not be your most profitable one.
Read articleProvider & Capacity Economics
Revenue per provider tells you who produces. It does not tell you who contributes. These articles separate production from profit and look at compensation, utilization, and when another hire actually pays for itself.
Start with
Helps diagnose: Your top-producing injector may not be your most profitable one.
Read articleThen
Helps diagnose: You are not sure whether your injector pay plan is quietly costing margin.
Read articleHelps diagnose: You are booking what you think is break-even and still losing money.
Read articleHelps diagnose: Payroll keeps rising along with revenue and eating the growth.
Read articleHelps diagnose: Your compensation plan may be paying for revenue instead of profit.
Read articleWard Advisory can help work out how large the financial impact actually is and what is driving it.